Explore Model Performance
Hi!
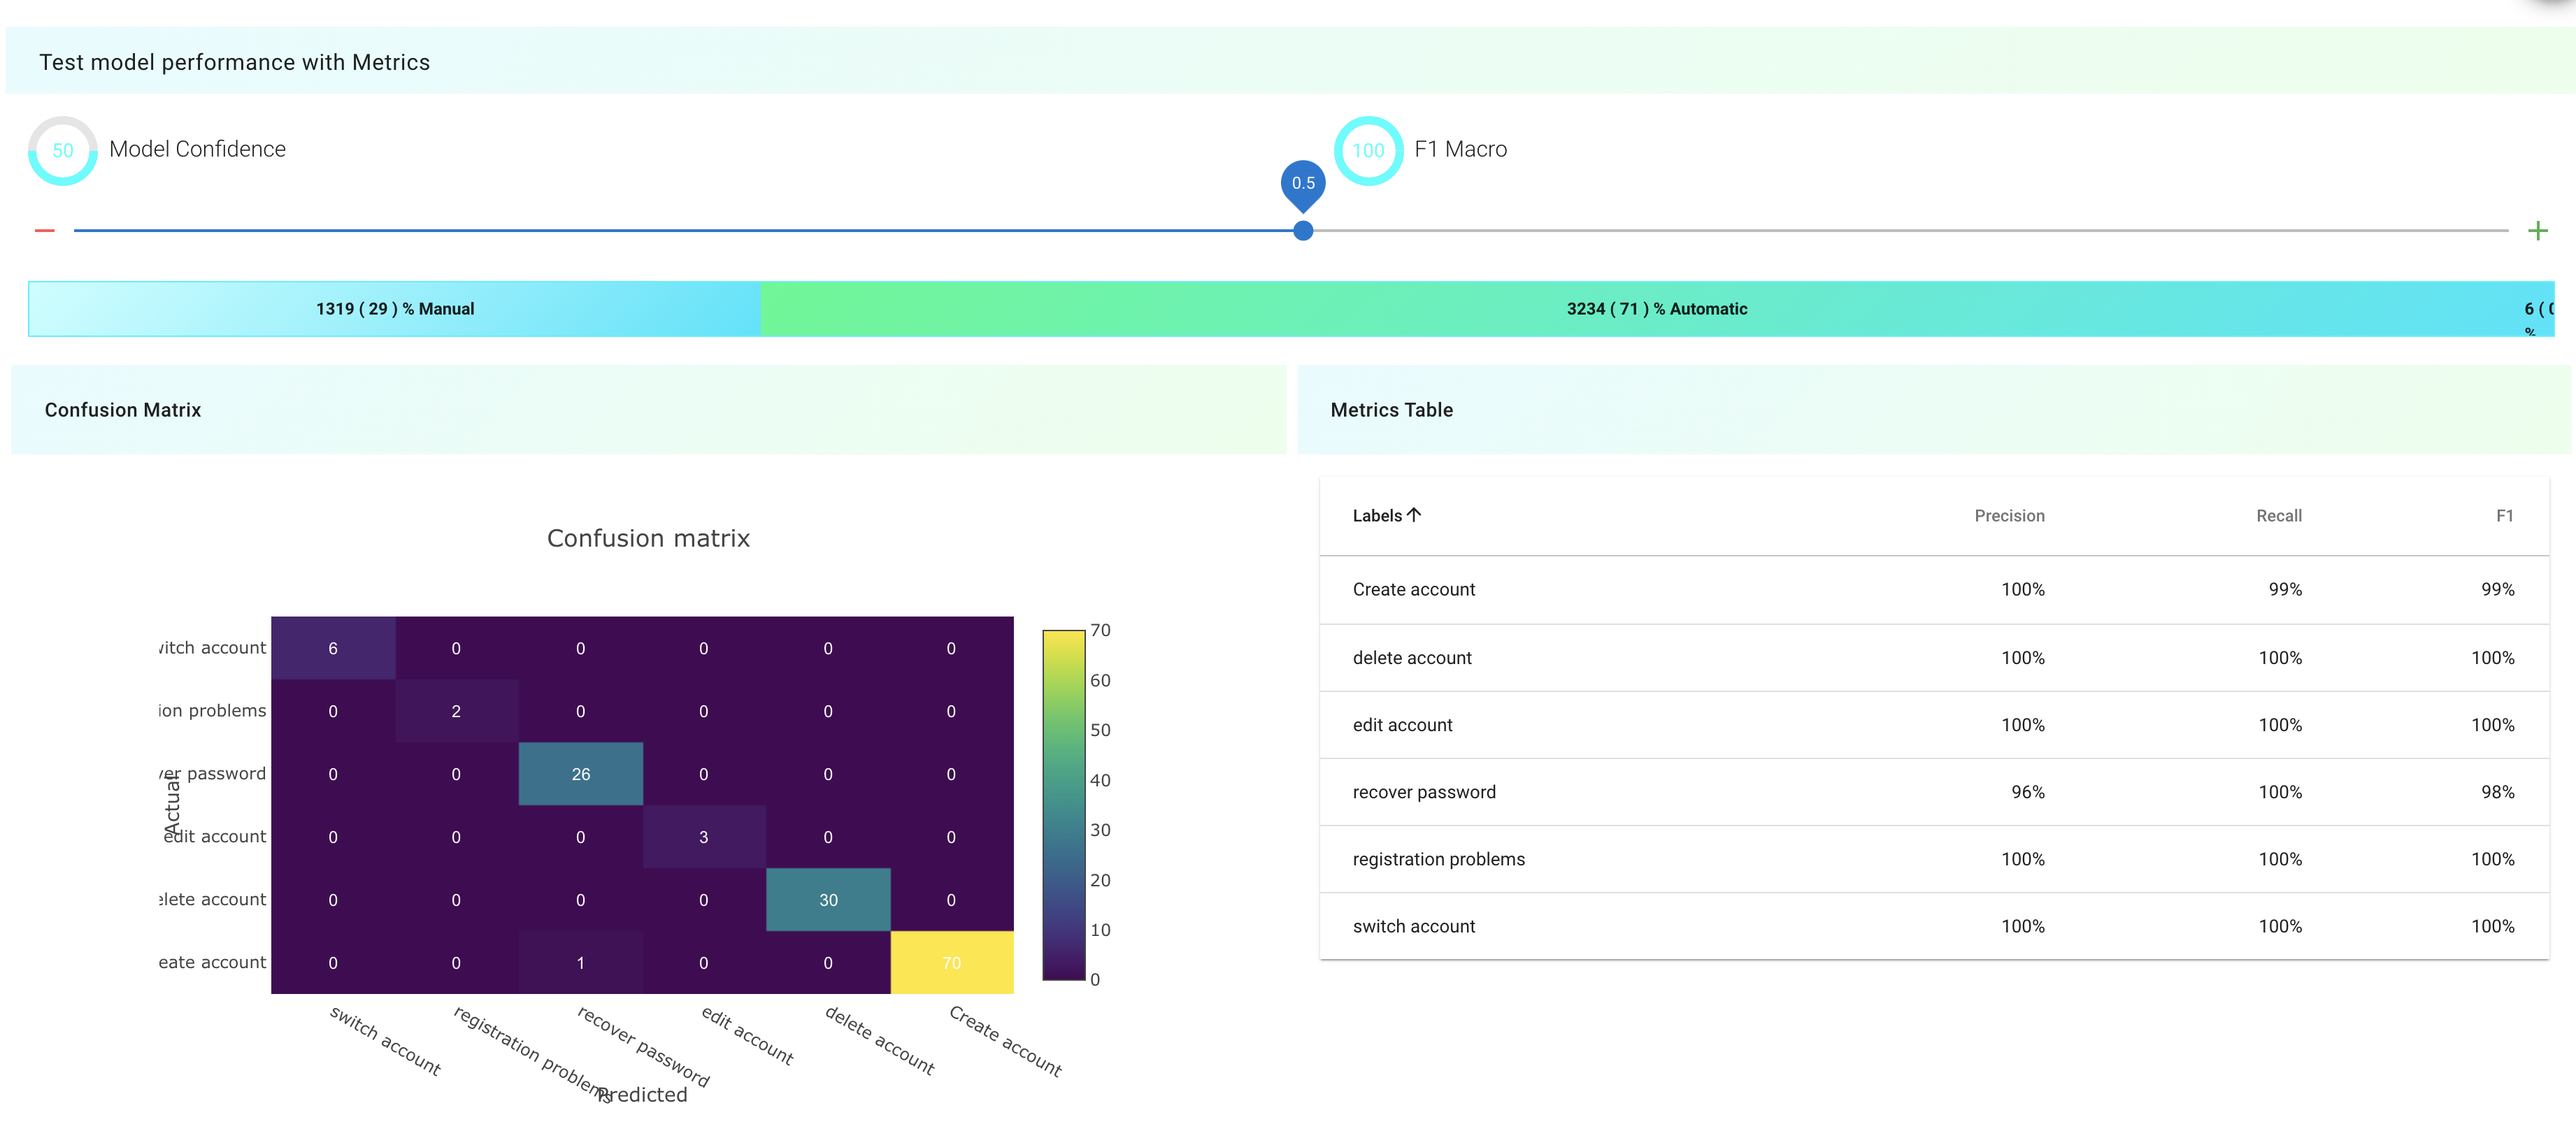
Let's take a tour of Labelfs metric page! When you enter the metrics view, you'll be presented with a summary of how your model is performing. In addition, you’ll also be presented with data covering our auto labeling option, should that be an option. If you’d want to auto label your dataset with Labelf, our AI will label all the data in a matter of seconds seconds! Let's go through the content of the metrics page.
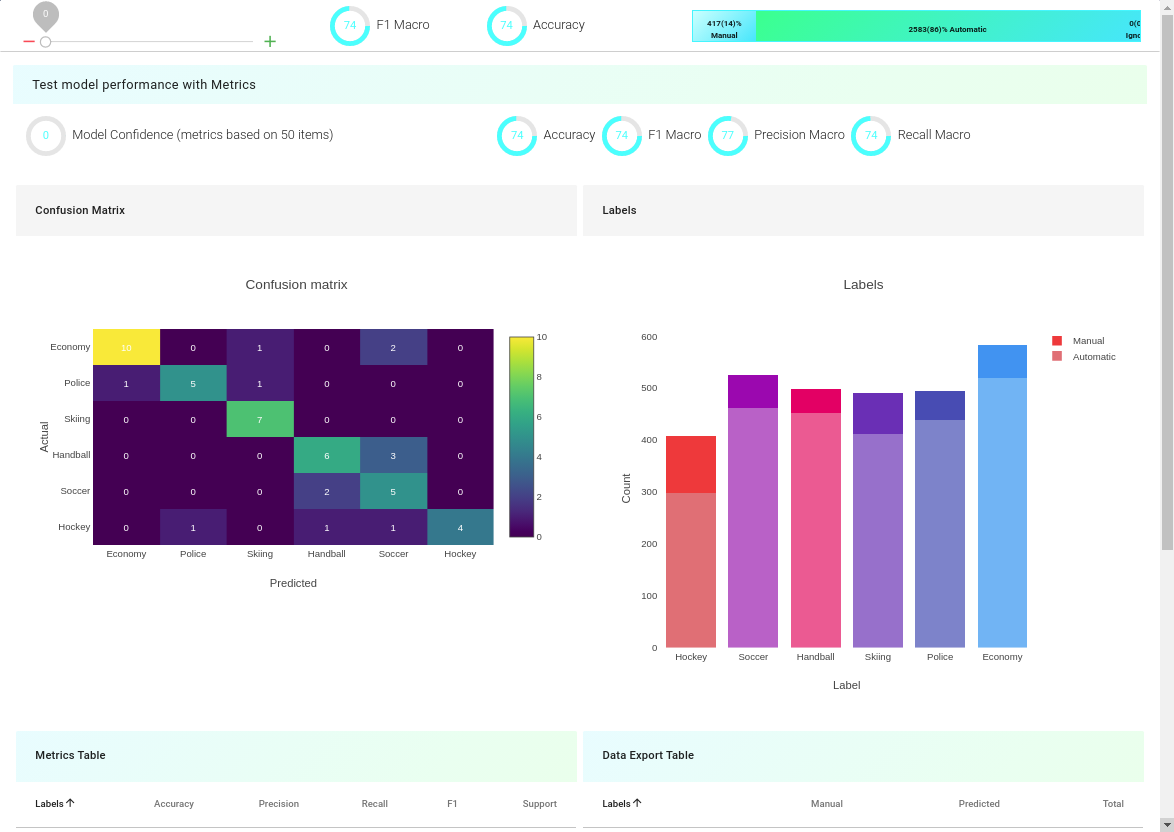
Let's first talk about the metrics. We have implemented a number of metrics for you to easily determine how the model is performing on your data. In addition to accuracy (which is a great metric but might not always fit your needs) we’ve added precision, recall and f1 as well. Just drag the slider in the top left corner to zero and check the performance (We’ll get to the functionality of the slider in a moment).

If you’re interested in a deeper understanding of the models performance, you could either check out the confusion matrix or the metrics table. Here, you'll get the validation data and metrics drilled down to class level.
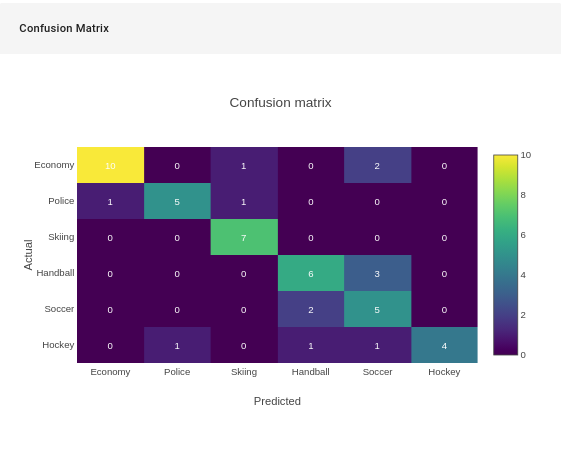
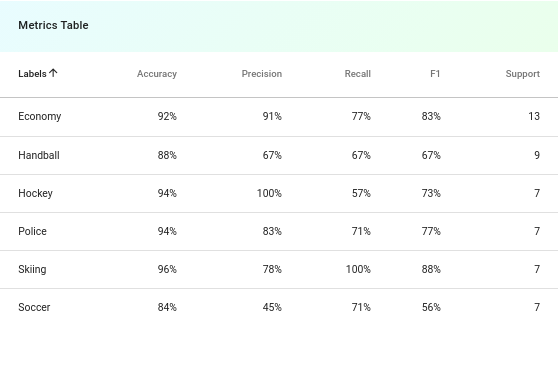
If you want Labelf to automatically label your data, it's time to operate the slider I talked about earlier. If you drag it to for example 0.95, the whole metrics view will be updated to reflect the models performance above 95% certainty. The confusion matrix and metrics will also be updated and you’ll be able to see how much data you’d be able to export by looking at the data export table. It will also show you how many examples you’ll get per label. The exported data will come as a .csv file, including your manually labeled data as well as the auto labeled data.
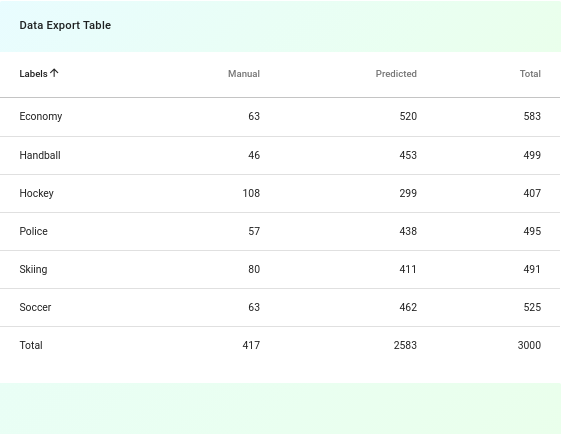
In the this particular example, we’d get the whole dataset auto labeled from just a few minutes of labeling. The dataset consists of 3k examples of news articles in Swedish (soccer, handball, hockey, skiing, economy and police).
Not half bad :)!


